Running a successful online store requires more than just setting up products and managing sales; it involves understanding your performance through comprehensive analytics. Our Store Analytics Dashboard is designed to give you a detailed view of your store’s performance, helping you make data-driven decisions to grow your digital business.
The Store Analytics Dashboard offers access to a wide range of individual reports directly from your site’s dashboard. These reports include:
Each section of the Store Analytics Dashboard includes common tools that allow you to dive deeper into your data. Here’s a quick introduction to these features:
Understanding the metrics is crucial for accurate analysis. Here’s how we define key terms:
| TERM | DESCRIPTION |
|---|---|
| Gross Sales | Sale price of product(s) multiplied by quantity ordered. Does not include refunds, coupons, taxes, or shipping. |
| Total Sales | Gross Sales – Returns – Coupons + Taxes + Shipping. |
| Net Sales | Gross Sales – Returns – Coupons. (Referred to as “Sales” in the legacy WooCommerce Reports.) |
| Orders | The number of new orders placed for a selected date range. |
| Average Order Value | Net Sales / Orders. |
| Items Sold | The discrete number of items sold. |
| Refunds | Money returned to the customer via a refund. |
| Discounted Orders | The count of orders with a coupon applied. |
| Net Discount Amount | Total sum of discounts from coupons. |
| Total Tax | Order Tax + Shipping Tax. |
| Order Tax | The total tax applied to items in an order. |
| Shipping Tax | The total tax applied to shipping in an order. |
| Shipping | The shipping charges associated with an order or refund. |
| Downloads | Total number of downloaded files. |
The Date Range Picker allows you to specify which dates to include in the report you’re viewing. You can quickly choose common date ranges such as Today, Yesterday, Week to Date, Last Week, Month to Date, Last Month, Quarter to Date, and Last Year. For more granular control, use the custom picker to manually enter start and end dates or select them from a calendar.
Depending on the report, there are various Quick Filters and Advanced Filters available to customize the data set being viewed. Filters are persisted to the URL, allowing you to save a quick link to a specific filtered version of a report.
At the top of the reports, the Chart and Summary Numbers provide quick access to key data, trends, and visualizations for changes over time.
Summary Numbers: Offer a quick view of the total figure for a metric over the selected period, the total for the period being compared, and the percentage trend between the two figures. Clicking on a Summary Number displays that metric in the chart.
Charts: Customize the visualization of data. Toggle the visibility of different data set periods, adjust the interval displayed in the chart, and choose between bar or line charts.
The table displaying detailed data on Analytics reports includes features to customize data display and download options:
Refunds appear as negative numbers on the date they occurred. They include discounts from coupons but do not include refunded shipping charges and taxes, which are tracked separately.
With our Store Analytics Dashboard, you have the tools you need to track, analyze, and optimize your store’s performance. Dive deep into detailed reports, customize your data views, and make informed decisions to drive your digital business forward.
Get started with our Store Analytics Dashboard today and unlock the full potential of your eCommerce store through insightful analytics and data-driven strategies!
Manage communication, files, media and projects in one place — every app you launch at gend.me gets a private Project Group to build, approve and scale your digital business.
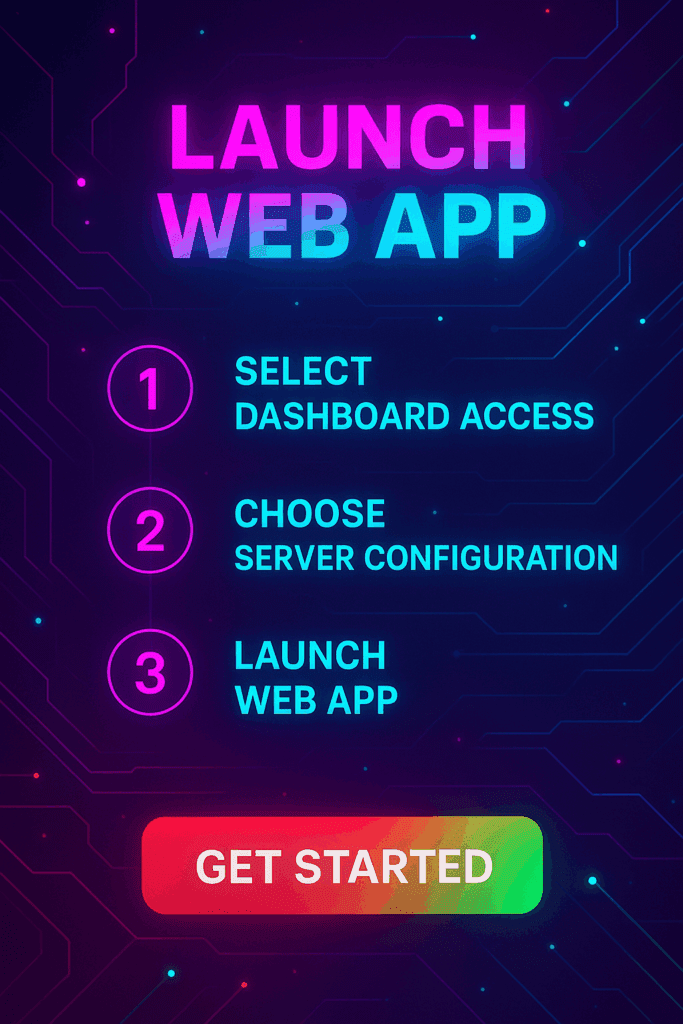
Every new Web App Launched at gend.me gains access to it’s own Digital Business Project Group!

We cannot display this workspace inside the popup.
Open workspace in a new tabWorkspace content is unavailable for this project.
Please sign in to view your workspaces.
Sign in to see your assigned tasks.
We could not load the activity feed inside the popup.
Open activity in a new tabLoading product fields.
Review the WooCommerce description for this product.
Loading product details.

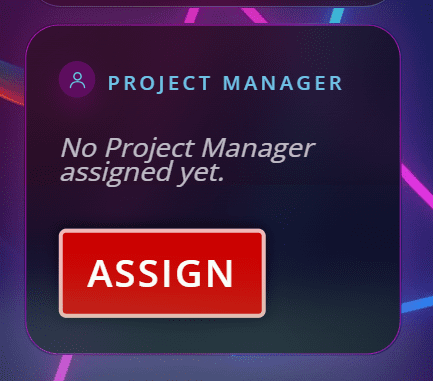
A vetted Project Consultant helps craft project plans, wireframes and delivery checklists so your app launches and grows with fewer surprises. They bring product, copy and design expertise that aligns work to your business goals.
Why they matter: Fast onboarding, clear next steps, and a single person who knows your goals.
How to assign (3 steps): 1. Open Project Group header → 2. Click Assign in Project Consultant → 3. Search, message and assign.
Auto-assign: If your referrer holds a Project Consultant role they will be suggested automatically
Self-assign: Click Assign in the Project Group header, browse available consultants, message a candidate and select the best fit.
Need help? Ask the Digital Navigator or request an introduction — consultants also monitor unassigned groups and will reach out.


Engage In Projects That Build The Network Of Web Apps & Grow The Business Owner’s Digital Business That They Support.
We are on a mission to give back ownership of Business Data To Business Owners & Take Away Being At The Mercy Of Another Platforms Policies & Rules.
 >>Launch Web Apps
 >>Project Manager
 >>Smart Wallet
 Smart Contracts